

Domain accounts kept getting brute-forced and locked for five years, firefighting every single time - until there was finally time to build an events dashboard

The company’s domain environment had been hit, on and off for years, by external brute-force attacks - targeting both domain admin accounts and regular employee accounts. Every occurrence looked roughly the same: a run of Event ID 4740 (“A user account was locked out”) in the Windows Security log, an affected employee finding themselves locked out, and IT handling it on the spot once the help request came in.
Five years, the same firefighting playbook
Looking back through the records, this class of incident kept recurring, and the response was almost the same template every time:
- Pull the recent lockout events off the domain controller with
Get-WinEvent -FilterHashtable @{logname='security'; id=4740}and manually go through the affected accounts; - Suspect some process or session was hammering away at password retries, and manually locate and kill the process;
- On one occasion the attack scaled up to an entire weekend, with dozens of accounts locked in succession, leaving no option but to copy the log entries into a spreadsheet one at a time, noting lockout time, affected account, and source domain controller;
- Send a mass notification to affected colleagues: “your account was recently automatically locked due to repeated login attempts from external sources - this is a protective mechanism our security system triggers automatically after multiple failed attempts; contact IT with any concerns,” with a reminder tacked on about recent phishing emails impersonating staff, and to always verbally confirm any request to change bank details by phone.
This playbook solves the immediate problem - accounts get unlocked, colleagues can log in again - but nothing is left behind once each incident ends. No trend chart, no sense of “is this happening more or less often than last month,” not even a clear answer to “is this the same attack source as last time.” Every new wave of lockouts started from zero, digging through logs all over again.
Finally finding the time to build an actual dashboard
After wrapping up one particular lockout incident, the decision was made: this can’t keep being solved by digging through logs from scratch every time. A combination of open-source PowerShell modules went into building a localized AD events visualization dashboard:
Install-Module Dashimo -Force
Install-Module PSWinReportingV2 -Force
Install-Module -Name PSWriteHTML -Force
PSWinReportingV2 is responsible for pulling various categories of audit events off the domain controller by type - not just account lockouts, but user changes, computer object changes, group membership changes, group policy changes, security-log-cleared events - a full picture of “what’s actually happening in AD.” Dashimo renders that structured data into an HTML dashboard, browsable and organized into tabs: computer changes, group changes, user changes, group policy changes, and log clears, each its own independent tab.
The first run came back empty - and that’s not a failure
With the script configured, the target domain controller specified, and the run complete, opening the generated HTML dashboard showed - most tabs displaying “No data available to display.” The first instinct is to assume the script was misconfigured, permissions were insufficient, or some parameter got missed.
But flip the perspective: this dashboard’s query window is “the last 3 days,” and this particular stretch of days simply hadn’t seen a new wave of attacks. The dashboard showing empty is exactly it faithfully reflecting “things have been quiet, no anomalous events” - this isn’t the tool being broken, it’s the tool working for real for the first time. For years, “firefighting” never had a place you could open and check on a quiet day - now there is one: empty when opened during calm periods means everything’s fine; the moment the next wave of attacks arrives, the same dashboard will immediately show the time distribution of lockout events and the number of accounts affected, with no more need to piece logs together from scratch in the middle of an incident.
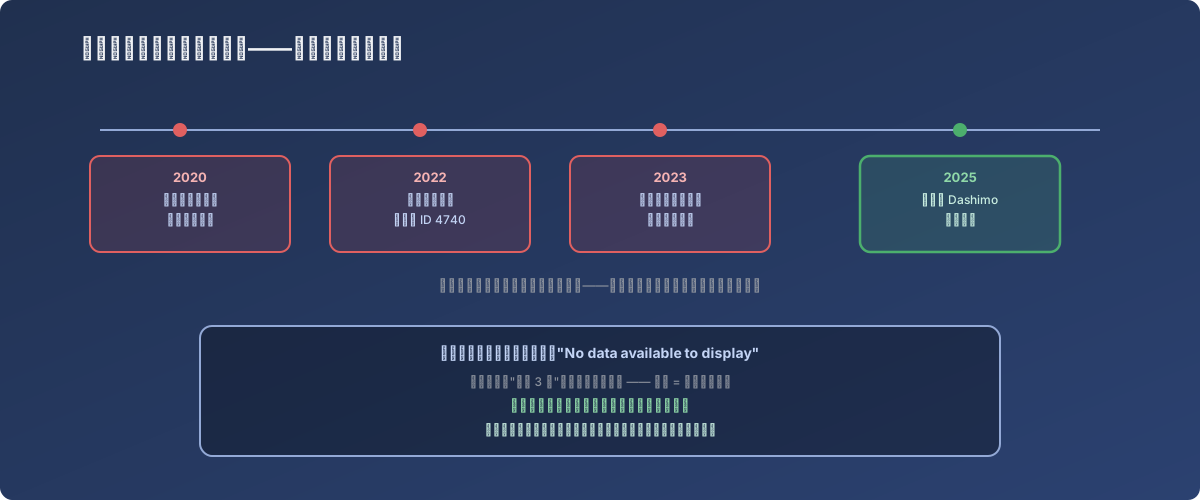
A dashboard that’s usually empty earns its value exactly when things stop being calm
Lessons
- A security incident that recurs but always ends with “handled, done” is the strongest possible signal to invest in observability tooling. If the same category of incident has already happened three-plus times, and each time relies on manually digging through logs, what’s missing isn’t emergency-response capability - it’s a retained, visualized history;
- When a dashboard’s first run comes back empty, ask “should this time window have had data” before suspecting a misconfiguration. An empty result and an erroneous result are two completely different signals, and conflating them means missing the information that the tool is already working correctly;
- When sending affected users a mass notification, spell out clearly that “this is an automatic protective mechanism triggering, not something you did wrong.” Having an account locked is unsettling enough on its own; tacking on a phishing reminder also turns the incident into a moment of security-awareness reinforcement, rather than just an outage notice;
- Years-old open-source ops tooling ecosystems (things like PSWinReportingV2 and Dashimo) often get you a usable dashboard faster than a hand-rolled script written under pressure. When the thought “this keeps happening, should I write my own reporting script” comes up, spend ten minutes searching first to see whether someone has already walked this road.